
GOAL
The purpose of this Power BI report is to view insights into the DCA-backed entrepreneurial loans in developing nations. A report and dashboard provide an interactive way of visualizing factors within your dataset.
OUTCOME
Dashboards and reports allow you to discover and uncover insights about your data by simply pointing and clicking. Try it out – click on the dashboard and select different graphics and filters.
Dashboards help you easily visualize your data to make effective decisions.
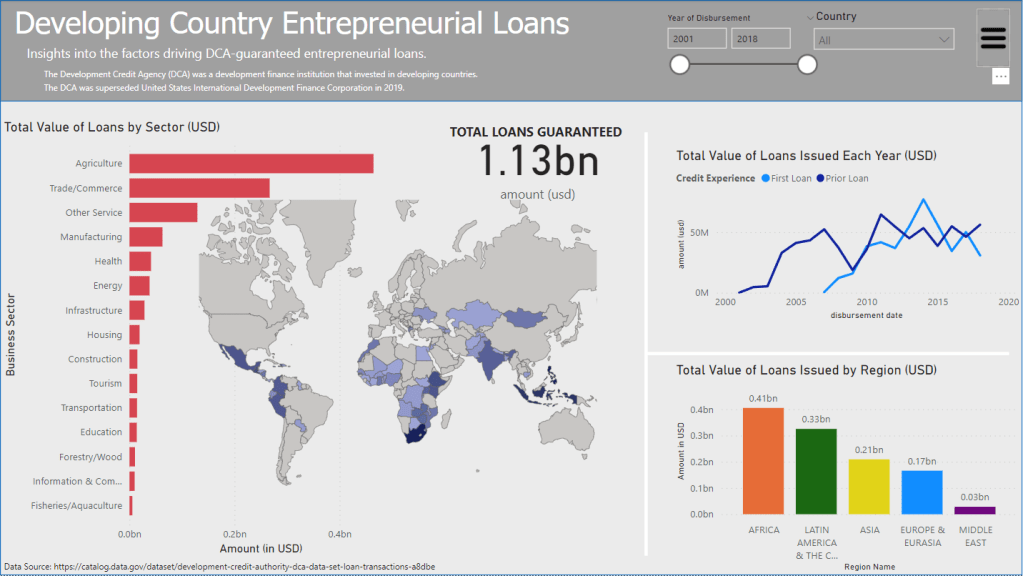
The Power BI report above is a real-world example, focusing on the total value (in USD) of loans guaranteed by the Development Credit Agency (DCA). Clicking on the above image takes you to an interactive dashboard where you can gain insights by drilling down into sectors, countries, and regions – among other factors.
A copy of the raw data, processed data, and Jupyter notebook are available here.
Helping you achieve analytics-driven success.
Locations
Auckland, New Zealand
Worldwide (Remote)
Contact
jayden@jaydenreuben.tech
+64 9 889 8031
