

Data Visualization:
Reports & Dashboards
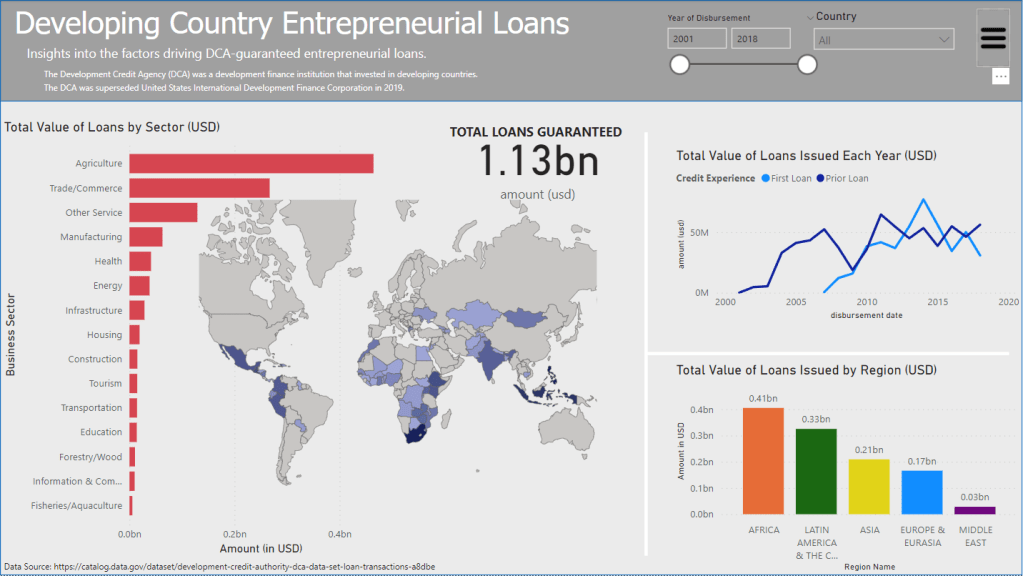
PowerBI Report – Visualizing International Loan Guarantees Data.
Report summary/page here.
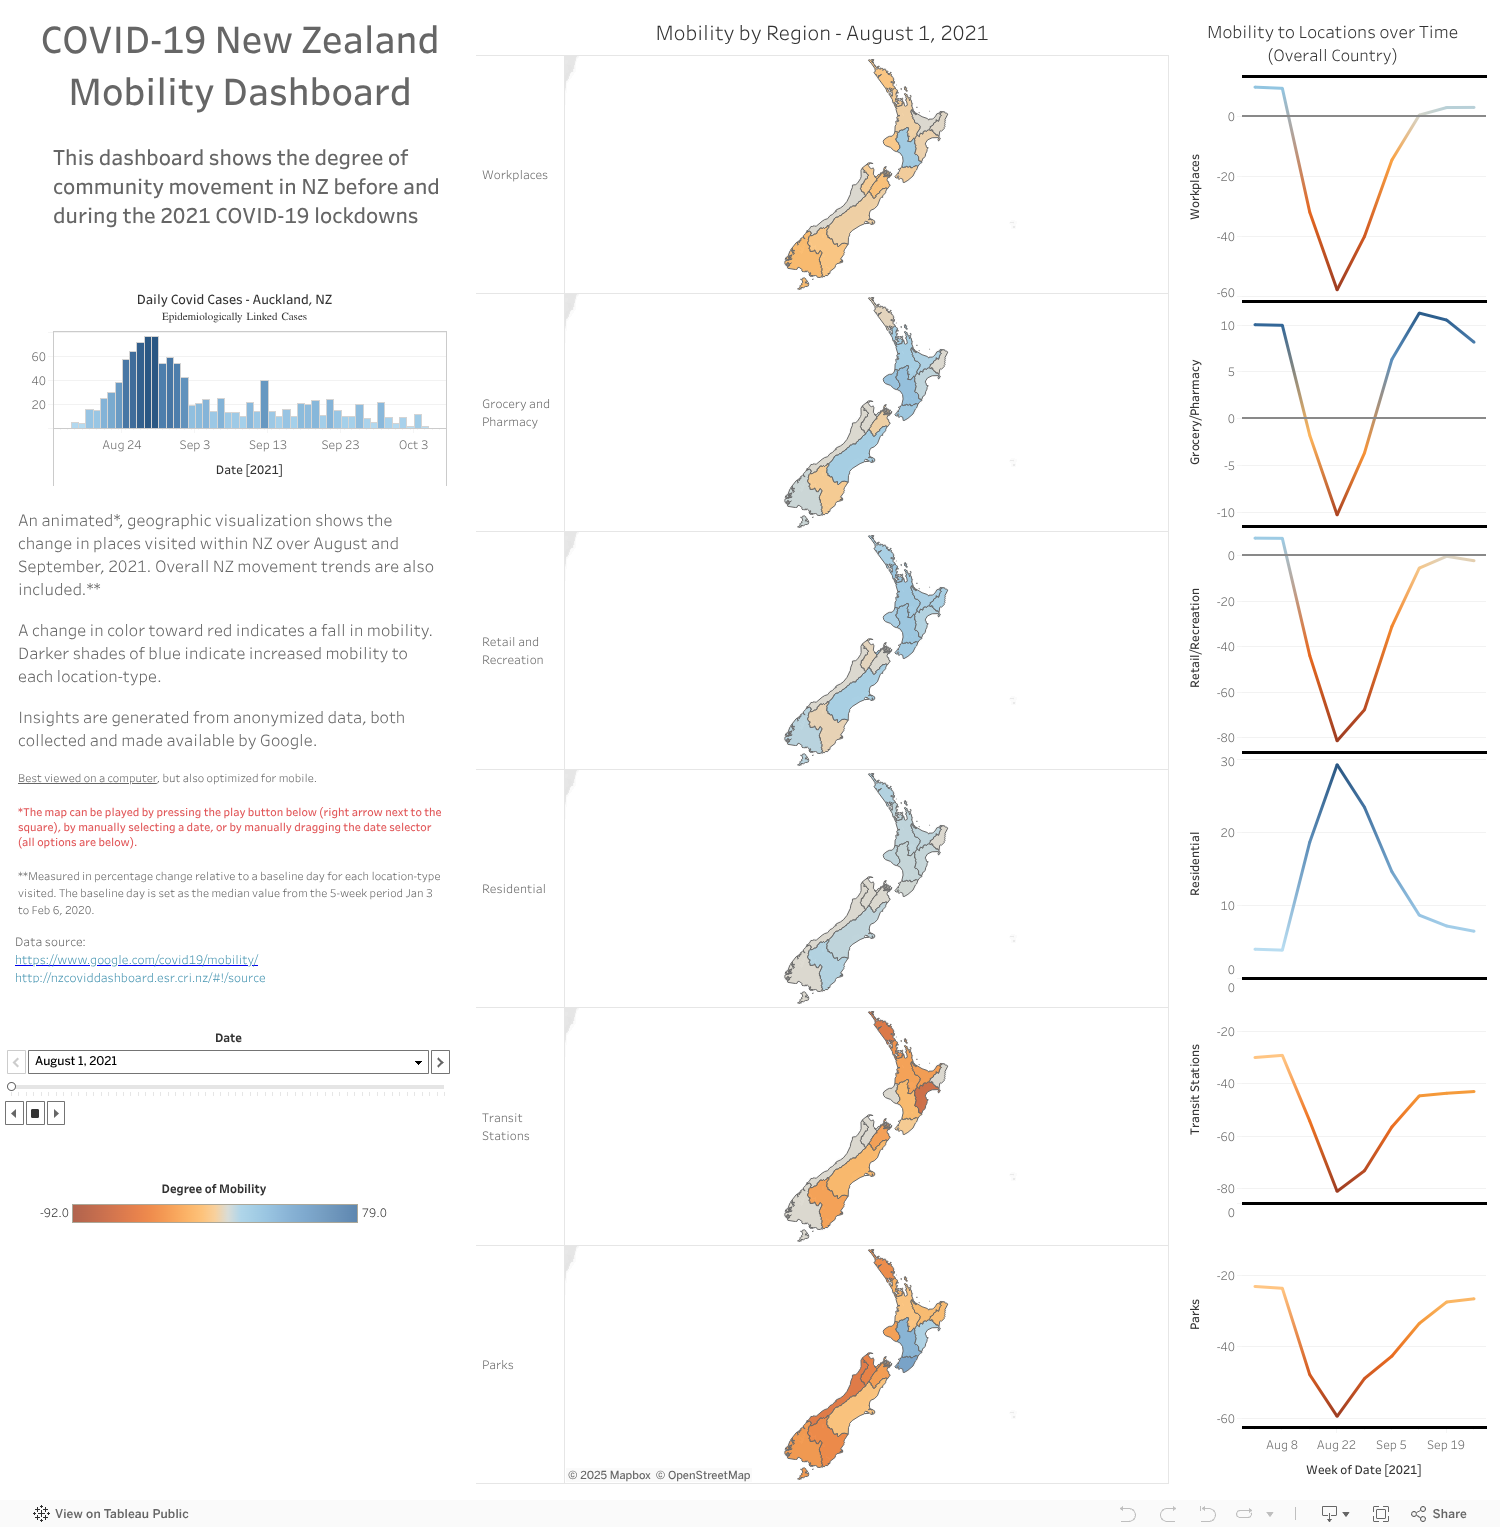
Tableau Dashboard – Visualizing Lockdown Mobility.
Dashboard summary/page here.
Point-and-click dashboards/reports so you can visualize and drill-down on data with ease.
The Tools
– Python (for cleaning)
– PowerBI (for making the dashboard)
– Can also use Tableau
The Job
- Defining problems to solve, collecting & processing data
- Sketch and design the dashboard
- Build the dashboard:
Includes linking the data, creating metrics, and constructing the report/dashboard. - Deploy the report/dashboard
Result
A stunning dashboard tailored to your data-driven business needs.
Helping you achieve analytics-driven success.
Locations
Auckland, New Zealand
Worldwide (Remote)
Contact
jayden@jaydenreuben.tech
+64 9 889 8031
